• Skip to primary navigation
  • Skip to main content
  • Skip to footer
Kanban University

Kanban University

Management Training, Consulting, Conferences, Publishing & Software

  • Contact Us
  • Certified Kanban
  • Events
  • Resources
  • About
  • Sign In

ESP

Your KPIs Probably Aren’t! But What Are They?

January 19, 2016 by David Anderson

This is the 2nd part of my post following Defining KPIs in Enterprise Services Planning.

Running our classroom exercises with private clients this past 18 months has shown me that most businesses have KPIs which really aren’t Fitness Criteria Metrics. In other words, their KPIs are not indicators of performance and certainly not key indicators or indicators of key performance. What I see as KPIs are really what should be classified as general health indicators and in some cases metrics driving specific improvements.

So what are general health indicators? Read more…

General Health Indicators

If we were to talk about individuals as people general health indicators are their pulse, their weight, their blood pressure, their cholesterol levels. If the individual was an athlete, they wouldn’t be setting goals based on achieving a certain blood pressure or a certain pulse rate but they would have expected ranges for these and they would monitor them. They might also monitor, for example, recovery time – the time it takes an accelerated heart rate to recover to a more normal level after stress.

Whether customers walk through your door is a health indicator. It is like having a pulse. Whether they buy something is also a health indicator and whether you had a positive margin in that sale and free cash flow are also health indicators.

In comparison, whether your customer is satisfied and whether they are likely to place repeat business and recommend you to a friend or colleague is a performance indicator. There are plenty of profitable businesses with lackluster stock price performance while others with growth but negative free cash enjoy elevated P/E ratios. They can always raise capital because their performance in the market is improving.

In Agile software development, velocity is a health indicator – you’d rather have some than not – but it is unlikely to be a performance indicator. The reason for this is that the volume or rate of production is not a fitness criteria for your customers and it is rarely a valued criteria even for internal stakeholders. Customers value things like delivery time, quality, useful functionality. You may believe velocity is a proxy for delivery time but it may not be. You may have a lot of velocity but a chronic, systemic problem with growing work-in-progress and ever longer delivery times. You are like a patient with a pulse but your blood pressure is trending the wrong way, your cholesterol is rising and your ability to get day-to-day tasks completed is being impacted. It could be your liver isn’t performing as it should be? If you set a target for your blood pressure you might be able to hit it by taking drugs – this is known as a symptomic fix which allieviates the symptom but fails to get to the root cause, as a result the problems persist and you end up back where you were again, a few months later. The same is true for companies. Many health indicators can be “vanity metrics” like boasting about your “at rest” heart rate – it isn’t always a fitness indicator!

Sure enough if you don’t have sufficient working capital, if you don’t have margin and profits and free cash, your corporate health is in danger, but as Richard Branson said, “People think companies exist to make profits. Wrong! They make profits in order to exist!” When you change to a mindset like Branson’s you start to see general health indicators for what they are, and you stop calling them “Key Performance Indicators.”

Metrics Which Drive Improvements?

While less common, it isn’t unusual to find a manager with a KPI on their scorecard which should rightly be classified as an Improvement Guiding Metric.

For example, we have poor customer satisfaction and a low Net Promoter Score because our delivery times are too long. In other words, the customer views lead time as a key selection criteria. Lead time is a fitness criteria metric and consequently lead time should be one of our KPIs.

In order to improve lead time, we decide that we want to automate testing because after analysis we discovered a significant portion of lead time is delay waiting for manual testing.

So we create an improvement goal to automate the testing of 85% of our application. We want 85% automated test coverage. So we start measuring and reporting the percentage of code covered by automated tests. We may even have placed this metric on the SMART goals for a manager. Despite all of this, it doesn’t make it a “Key Performance Indicator”. Instead it is a derivative of a KPI. The true KPI is lead time. We believe that by improving automated testing we will improve lead time. We may have causation to determine this or it may simply be a postulation and an experiment. The true KPI remains the customers’ fitness criteria – the lead time. So automated code coverage percentage is an Improvement Guide Metric.

Classifying Your Metrics

In our Enterprise Services Planning workshops, we have a series of exercises on metrics and the specific exercise on classifying existing KPIs is particularly enlightening for clients. They discover that most, if not all of their existing KPIs, are in fact health indicators and some improvement guides. Often the clients are not measuring anything which affects customer satisfaction. It is no wonder then that they aren’t happy with the NPS results.

What About Metrics That Aren’t in Any Of The Categories?

During the exercise, clients often find existing metrics they are measuring and reporting which can’t be classified as Fitness Criteria Metrics, Improvement Guides or General Health Indicators. The reality is these are metrics they probably don’t need and should drop. Often these are legacy metrics – metrics that were guiding earlier improvements, or perhaps fitness criteria that no longer apply because the company doesn’t serve that market segment any longer, or the customers in that segment have changed their opinion about what is acceptable and what represents “fit for purpose.” In some cases, the metrics are simply things the business could see and was capable of measuring. They serve no useful purpose.

To discover if a metric has a useful purpose ask yourself, “What decisions does this metric affect?” “What would we do differently if this metric rose or fell or hit some threshold value?” If you can’t identify an action or outcome you expect as a consequence of reporting a metric then you don’t need it.

When clients complete our Enterprise Services Planning workshop they often find they need far fewer metrics than they were already capturing and reporting but equally they need new instrumentation in order to capture the fitness criteria they’ve discovered from thinking about market segments in a new way and seeing their product or service through the customers’ eyes.

Filed Under: ESP Tagged With: Enterprise Services Planning, ESP, Fit for Purpose, Fitness for Purpose, Key Performance Indicators, KPIs

Defining KPIs in Enterprise Services Planning

January 15, 2016 by David Anderson

All KPIs should be fitness criteria metrics. All KPIs should be recognizable by your customers and addressing aspects of how they evaluate the fitness of your product or service. If your customer doesn’t recognize or care about your KPIs then they aren’t “key”, “performance” indicators, they may indicate something else but they aren’t predictors of how well your business is performing or likely to perform in future.

This blog follows my recent posts on Market Segmentation and Fitness for Purpose Score explaining how we define Fitness Criteria Metrics. These metrics enalbe us to evaluate whether our product, service or service delivery is “fit for purpose” in the eyes of a customer from a given market segment. They are effectively the Key Performance Indicators (KPIs) for each market segment. All other metrics should either be guiding an improvement initiative or indicating the general health of your business, business or product unit or service delivery capability. If you can’t place a metric in one of these categories then you don’t need it.

Project Manager and Mom

Read more…

Fitness Criteria Metrics

We left our story of Neeta the busy project manager, mother of 4 kids, having established that she represents a member of two market segments – the “working late ordering food for the team in the office” cluster, and the “feed my children, its an emergency!” cluster. We also determined that the main metrics of concern are: delivery time; quality – both functional quality (the menu and order accuracy) and non-functional quality (hot, tasty, artisan, gourmet or maybe not); predictability (of delivery time, and perhaps of quality too); safety or regulatory concerns, perhaps including trust that organic ingredients were used or not. In our example, these 4 main metrics apply whether Neeta is ordering pizza for the team or whether she is ordering for her family. However, the satisfaction thresholds vary significantly based on the context.

When Neeta orders for the team they are happy to wait an hour to 90 minutes for delivery. If minor errors are made in order accuracy it is unlikely to matter too much. However, there is a threshold. If some of the team are vegetarian then there must be some vegetarian pizzas delivered or we’d consider the order a failure. The menu is important in the sense that the geeks want a more exotic set of choices. They are fussy about their non-functional requirements. They want the pizza hot, tasty, artisan and gourmet. They aren’t too particular about predictability of delivery time or order accuracy. A 30 to 45 window for delivery is probably acceptable and a few minor errors in the order is also acceptable. They do care about health and safety in the restaurant but they only care about the traffic safety of the delivery boy in so much as it doesn’t endanger the quality of the pizza on arrival.

When Neeta orders for her family, the threshold levels are significantly different. The kids are really hungry and impatient and now they know that pizza is coming, they are super-excited about it. Fast delivery is essential. Predictable delivery is essential: the 6 year old is now running his countdown timer on his iPad. The menu was important but only in so far as it offered simple plain cheese pizza with tomato sauce. The kids are so excited that they won’t mind if the pizza is a little cold on arrival, nor will they mind if it got shaken up a bit during transportation. Order accuracy is important to the kids. If it isn’t a plain cheese pizza they will be extremely upset and unlikely to eat it at all. Meanwhile, mommy can worry about safety and regulatory concerns but they may have a preference for a restaurant that promises to use organic ingredients. They have no concept of whether they trust this assertion. The restaurant said it was organic – mommy can worry about whether that is true or not.

So in summary…

Kids

Fast delivery

100% order accuracy

Not concerned too much on non-functional quality

Predictable delivery

Not concerned too much on safety or regulatory concerns

Geeks

Longer delivery acceptable

Some errors in order accuracy acceptable

Extremely fussy about non-functional quality

Wider tolerance for unpredictable delivery

Not too concerned about safety or regulatory issues

In 4 of these 5 categories we have significantly different fitness evaluation thresholds for these two segments.

If we are to successfully serve both segments, driving improvements so that we have high levels of customer satisfaction in both segments, we must use the higher thresholds with each metric as our benchmark. Alternatively, we need to segregate our service delivery by segment. We can do this by introducing two classes of service, one of each segment. This might work through pricing, for example, would Neeta pay a premium for the guaranteed fast delivery for the kids? Or it might work through capacity allocation and demand shaping based on it. We might, for example, refuse to take large commercial destination orders during peak times for domestic orders. In this example, we trade off educating our corporate clients to order earlier in the day, versus the risk that they will go elsewhere. We do this because we value the domestic market.

There is no formula for this. No right or wrong. We make choices for our business in terms of which segments we wish to serve and how well we wish to serve them. Choices come with consequences. We need to be prepared to live with these consequences and be willing to be accountable for them.

The metrics and threshold values we’ve developed for each of our segments should become the KPIs for our business and specifically in this case, the pizza delivery service. We should put in place the mechanisms, instrumentation and customer feedback, to measure these metrics. We can use the results at Service Delivery Reviews, Operations Reviews and Strategy Reviews to determine how well we are serving our markets, where we need to make improvements and which segments we wish to serve.

In my next post in this series I will take a look at the other types of metrics: those which guide improvements; and general health indicators. My experience working with clients in 2015 is that most existing KPIs are in fact merely general health indicators. As a consequence these businesses are optimizing for the wrong things and customer satisfaction and their ability to survive and thrive in the market is impaired. All KPIs should be based on threshold values for fitness criteria metrics derived from analysis of the market segments you choose to serve.

Read Part 2: Your KPIs Probably Aren’t! But What Are They?

Filed Under: ESP Tagged With: Enterprise Services Planning, ESP, Fitness Criteria Metrics, Fitness for Purpose, Kanban, Key Performance Indicators, KPIs, Marketing, Strategic Planning

Market Segmentation for Enterprise Services Planning

January 14, 2016 by David Anderson

I realized after posting my article on Fitness For Purpose Score that it isn’t reasonable to expect readers to know the background and context that stimulated it. It isn’t reasonable that I assume readers are up-to-date with speeches I’ve given ove the last two years covering Evolutionary Change, Fitness for Purpose and Enterprise Services Planning. So I felt some explanation of how we do market segmentation for ESP was in order to provide better context for Fitness For Purpose Score.

How do we know whether a change in our service delivery capability represents an improvement? This is the fair and reasonable question that should drive our decision making about how we manage, how we make decisions, and which changes we choose to invest in, consolidate and amplify. In evolutionary theory, a mutuation survives and thrives if it is “fitter” for its environment [this is actually a gross simplification but it will do for introductory paragraph on a related but different topic of marker segmentation.] So how do we know whether or not a change to our service delivery capability makes it fitter for its environment? What do we mean by “environment” in this context? “Environment” is the market that we deliver into. So “fitness” is determined by whether the market feels our product or service and the way we deliver it, is “fit for purpose.” So to understand “fitness” to enable and drive evolutionary improvements, we first need to understand our market and what defines “fitness for purpose.” To do this we segment the market by customer purpose and the criteria with which they evaluate our “fitness for [that] purpose.” …

At Lean Kanban Inc we create our market segmentation by clustering narratives about our customers. We do this by telling stories about them. The technique is a direct application of Dave Snowden’s technique from his Cynefin Framework. To explain this in our training and in the speeches I linked above, I tell the tale of Neeta, a fictional project manager and mother of 4. Neeta is based on a real woman who works in the Canadian public sector and has considerable Kanban expertise. Neeta needs to order pizza for delivery to her office to feed her team who are working late against a deadline. On another evening the same week, she needs to order pizza for delivery to her home to feed her children who are hungry because she came home late. Neeta doesn’t represent one market segment, she represents two! The reason for this is that the purpose, context and fitness selection criteria are different in each of the two contexts.

Project Manager and Mom

When Neeta orders pizza for her children she needs: fast delivery – ideally within 20 minutes; she needs order accuracy – the kids only like plain cheese pizza; the non-functional quality doesn’t matter too much, the kids will eat cold pizza so long as it is cheese pizza; she needs a simple menu and predictable service; she wants delivery when promised because the kids need their expectations set and they are unforgiving; she also cares that the restaurant is clean and can be trusted to follow health and safety regulations; she may care whether or not they use organic ingredients because she is feeding her family.

When Neeta orders  pizza for her office her need are similar but some of the criteria vary and the threshold values are different: she needs delivery in up to 90 minutes; order accuracy is important but if one or two mistakes are made it won’t make a big difference; however, the non-functional quality matters, hot, tasty, pizza with gourmet flavors and exotic ingredients are required for these discerning geeks; it doesn’t matter if delivery isn’t as predictable as it might be, so long as they show up eventually – the team are busy; and yes, she still cares whether the restaurant meets health and safety legislation standards but organic ingredients probably isn’t so much of a concern.

In other words, Neeta decides whether she likes the pizza service and whether she will use it again, based on two different sets of criteria, depending on her context. This may lead her to use different service providers for each purpose, if one provider can’t meet both sets of her needs. As a result Neeta represents two segments, not one.

Pizza Boy

How would you know that Neeta represents two segments and not just one? Traditional demographic profiling wouldn’t give you this insight! Well perhaps she uses different credit cards or payment mechanisms depending on context? And the delivery address is different. So there are some obvious clues. However, the people in the business who know Neeta’s story are the person who took her telephone order, and the delivery boy who delivered the pizzas. It is these frontline staff who understand the customers best.

If you are to cluster customer narratives to determine segmentation, you need to bring frontline staff into the story telling sessions. You need to listen for context, purpose and selection criteria and create segments based on affinity of these aspects of the market. Give each cluster a nickname. Recognize that an individual customer can appear in multiple segments depending on their context on a specific day and time.

The challenge of this for many companies is that the people who best understand the customer’s context, purpose and selection criteria are often the lowest paid, shortest tenured, highest turnover staff in the business. Foolishly, many companies under value, the value of customer facing staff. Traditional 20th Century service delivery businesses take a transaction view of customer interaction rather than a relationship view. If you value repeat business and you value the insights that will enable your business to evolve and survive in a rapidly changing market then you need to value customer facing people and involve them in your strategic planning.

Once you have the clustered narratives defining your segment, now select the segments you want to serve. This is a key piece of strategic planning. Which businesses do you want to be in? Which don’t you care about? Which do you want to actively discourage? Based on this you will develop the Fitness Criteria Metrics to drive your management decision making and evolutionary improvement.

Designing Fitness Criteria Metrics, choosing their threshold values, and making them your KPIs (Key Performance Indicators) will be the subject of my next post.

Filed Under: ESP Tagged With: Enterprise Services Planning, ESP, Kanban, Marketing, Strategic Planning

Kanban Cadences

April 23, 2015 by David Anderson

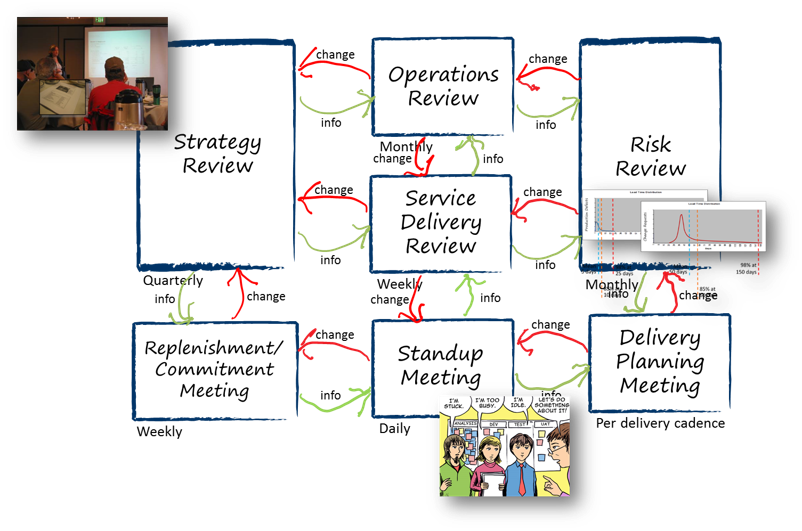
Recently, I’ve taken a new approach to teaching The Kanban Method. The new Lean Kanban “Practicing the Kanban Method” class is built around the 7 Kanban Cadences – the cyclical meetings that drive evolutionary change and “fit for purpose” service delivery. Two of these meetings are relatively new additions to the method: Risk Review added in 2014 as a response to Klaus Leopold formalizing Blocker Clustering in 2013; and Strategy Review as an emergent response to the concept of “fit for purpose” and the need to sense the external environment, in order to be able to respond appropriately. The other 5 were existing elements of the method, though the first edition of my Kanban book ommitted Service Delivery Review. In truth our training has not until now emphasized these meetings and particularly replenishment/commitment and delivery planning have not been explicitly taught. Little wonder then that these very basic functions of Kanban have not been well implemented in the field.

kanbancadences

When implementing the 7 cadences we don’t expect people to add seven new meetings to their organizational overhead. Instead we expect to find existing meetings that change be adapted and tuned up. Also at smaller scale we expect the meetings to be combined. We’ve also got one client who combined SDR with Replenishment/Commitment because the audience was the same. However, the SDR is on a bi-weekly cadence while Replenishment is weekly. To facilitate the combination they simply increase the meeting time by 30 minutes every other week. Delivery Planning is covered in the Kanban book but is for the first time being emphasized separately in training. Showing that Replenishment and Delivery Planning are separate meetings emphasizes the deferred delivery commitment taught in the class and really helps to underscore differences with methods such as Scrum where the two are combined and coupled together. By decoupling commitment to service a request from commitment to a specific delivery date, you can increase customer satisfaction by better managing their expectations and making promises you know you can keep. It’s been an important element of Kanban since 2006 and finally we are making it more  explicit in our training.

There are 10 feedback loops on this diagram showing information flow and change request flows between the different meetings. Information flow is intended to facilitate decision making for example, output from a replenishment meeting would appear as information at a standup meeting. Change requests imply that something is not working well enough, that there is perception that some current policy is leading to an outcome that isn’t “fit for purpose,” for example, both SDR and Ops Review will provide capability information to a Strategy Review together with a requets for a change of strategy due to a lack of operational capability to deliver on current strategy.

Filed Under: ESP Tagged With: Feedback Loops, Kanban, KanbanESP

ESP compared to Kanban Method

April 23, 2015 by David Anderson

I’ve been giving some careful thought to why it became necessary to create the concept of Enterprise Services Planning.

At the most fundamental level, ESP was necessary to provide a container for the collection of things we were teaching that were beyond kanban systems and beyond the scope of the Kanban Method. These were the things that enabled the optimal and effective use of kanban systems – topics such as: probabilistic forecasting and statistical analysis; qualitative risk assessment; real option theory; connecting strategy to operational mechanisms such as Kanban capacity allocation; and so forth. ESP represents a system of management for an entire professional services business. It isn’t just an IT thing and it certainly isn’t just for operational management of a single service delivery workflow. So we needed a name that encompassed concepts that were a lot bigger than Kanban.

The second reason is that we needed a concept and a message that resonated with senior executives – something that would help them understand why they should care about Kanban and what it might do for them. Enteprise Services Planning seem to fit that bill. The focus on “fit for purpose” and evolutionary change based on sensing the external environment and responding to changes on the outside with changes on the inside, seems to appeal to senior executives.

This led me to the conclusion that Enteprise Services Planning (ESP) is intended to be implemented Top-Down and is focused from the Outside-In.

The truth of the Kanban Method, as those who’ve attended a coaching masterclass will tell you, is that it was intended and designed as “change led from the middle.” It was a method to effectively lead and implement successful change for middle managers not endowed with large budgets, significant power, and a mandate for a large scale change initiative. However, we have to recognize that the working reality of Kanban adoption around the world is that it is largely Bottom-Up and from  the Inside-Out. We even address this in our scaling advice when we talk of first scaling up and down the value-stream. The assumption is that the most likely proto-kanban implementation is focused on the middle of a end-to-end service delivery workflow. The input to the proto-kanban isn’t coming from the direct customer but is a hand-off from an upstream partner, and often the delivery from the system isn’t directly to the original requestor either but to a downstream partner who may batch things for delivery.

So Kanban has been Bottom-Up and Inside-Out while we anticipate Enterprise Services Planning to be Top-Down and Outside-In. This means we anticipate a whole different approach to selling ESP in comparison to selling Kanban. We also expect the approach to training and adoption to be different. Initially we are only offering ESP training privately directly to clients on their premises, while Kanban training is extensively open registration and easily delivered to mixed groups from many employers.

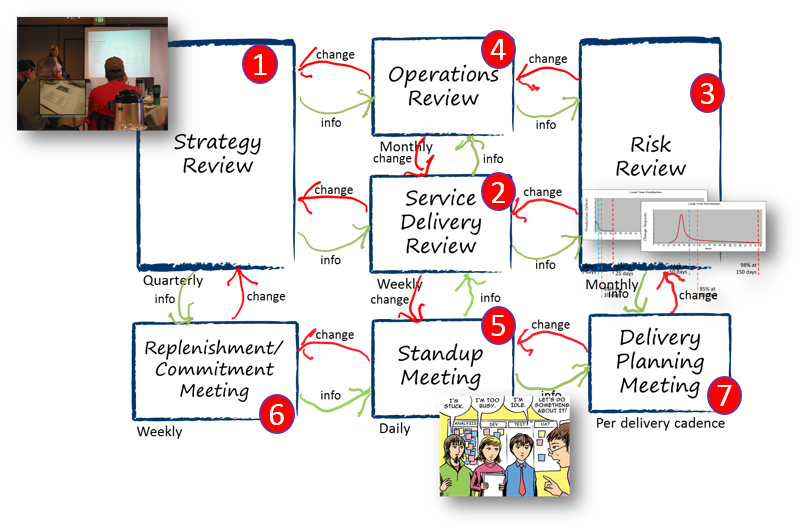
We also anticipate the adoption of the Kanban Cadences to be different. With ESP we expect to start at the top and lead with strategy. This diagram shows the anticipated adoption sequence of Kanban Cadence meetings during an ESP initiative.

kanbanespcadenceadoption

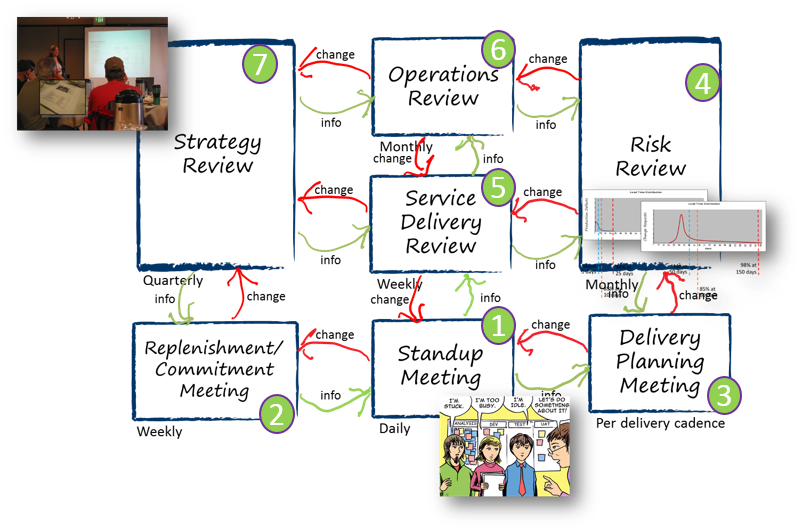
If we compare this to the expect adoption for a typical Kanban initiative, you can see how different it appears

kanbanmethodcadenceadoption

With Enterprise Services Planning, Kanban (represented by the Replenishment/Commitment, Standup and Delivery Planning meetings) comes last, as we don’t automatically assume that use of kanban systems is the solution to “fit for purpose” service delivery and a more successful business. We start by understanding the problem from the business perspective in terms of what businesses and markets do they wish to be in, and from the customers’ perspective in each of those market segments.

With Kanban, initial shallow adoption has tended to be internally focused and intended to provide relief from overburdening and to smooth unevenness in flow. The benefits to the customer are potentially coincidental. The motivation is usually to make things easier for the workers. With ESP the focus is explicitly on the customer and the business strategy right from the start.

Filed Under: ESP Tagged With: Enterprise Services Planning, Kanban, Kanban Method, KanbanESP

LKNA15 Miami – Enterprise Services Planning – the Future of Kanban

April 5, 2015 by David Anderson

Lean Kanban North America takes place in Miami, Florida 8-10 June 2015 at the Eden Roc Hotel on Miami Beach. This year we are both going “back to our roots” while “looking to the future” with a very specific Kanban practitioner event. If you are already doing Kanban and want to know how to take your practice to the next level, or you are curious how to scale the benefits to your entire organization or a business unit, or you just want to know how to apply Kanban outside of IT and software development, then this is the event for you!

In 2015 we launched Enterprise Services Planning, a management system for creative and knowledge worker industries that encourages improved service delivery, better customer satisfaction and a business that is “fit for purpose.” Are you curious about Enterprise Services Planning and how it leverages Kanban to improve your business? Are you curious to see the latest Enterprise Services Planning software solutions? You need to be in Miami this June at Lean Kanban North America. We’re back to our roots in the same city as our first conference in 2009, while we look to the future with the enterprise-wide management solution, Enterprise Services Planning (ESP). We’ll have a full pavilion of vendors offering ESP solutions – come and see the latest software and learn about our new modular 5-day training program in ESP.

wp_20150325_15_25_59_pro_1

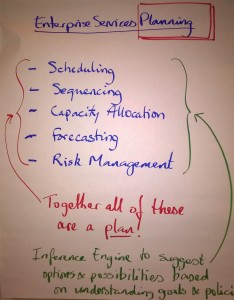
Your business is an ecosystem of interdependent services. You can learn to manage these better with Enterprise Services Planning. ESP is about scheduling and sequencing work, forecasting delivery dates and outcomes, allocating capacity and managing dependencies, understanding risk and learning how to hedge it and embrace it for opportunity and economic benefit. Learn to run an effective, risk managed, business, that produces superior customer service and both “fit for purpose” and robust & resilient to a rapidly changing external environment, using ESP. Enterprise Services Planning is the new way to manage your complex, modern 21st Century business. ESP software solutions make it easy to translate what you learn into action. Come to Miami and experience how the future of work will be managed.

Register now! http://lkna15.leankanban.com/

Filed Under: ESP Tagged With: Conference, Enterprise Services Planning, Kanban, KanbanESP, Leadership, LeanKanban North America, LKNA, Management, Management Training

  • Go to page 1
  • Go to page 2
  • Go to Next Page »

Footer

Subscribe to our newsletter

Privacy Policy

Address

Kanban University
1570 W Armory Way Ste 101,
#188, Seattle, WA 98119
USA

Contact Us

info@kanban.university
© 2022 Kanban University. All rights reserved. Accredited Kanban Trainer and Kanban Coaching Professional are registered trademarks of Kanban University.